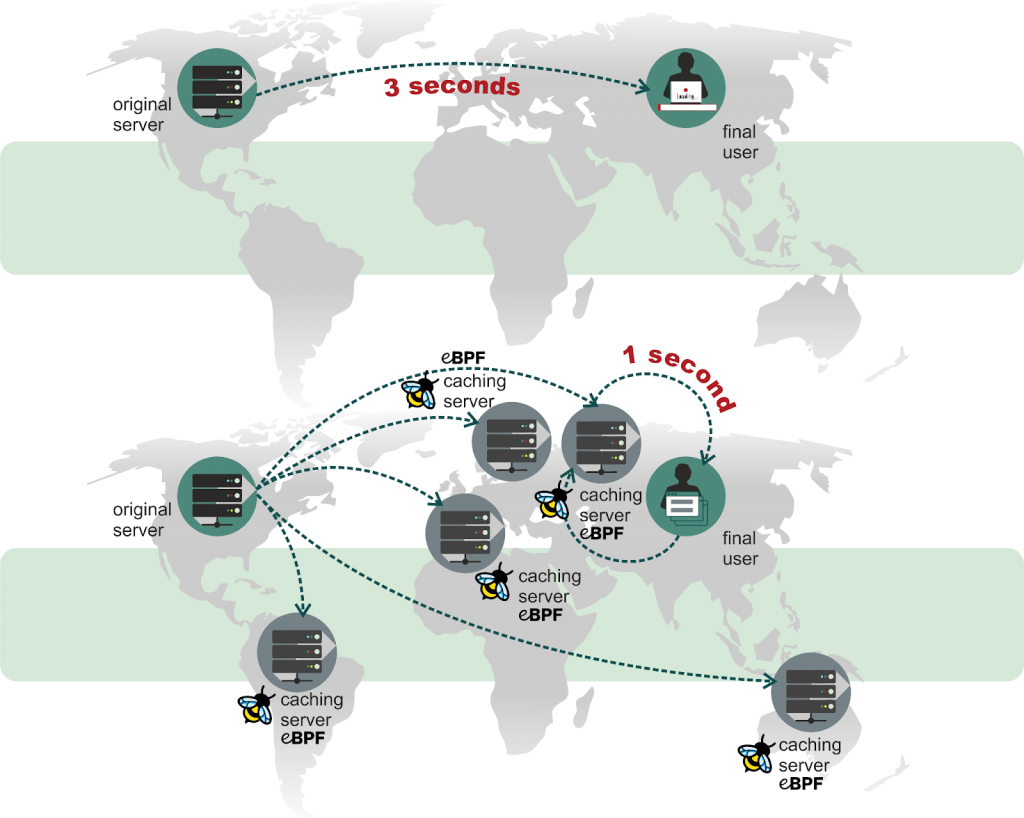
Latency is crucial for a web site performance. It consists of many factors, like network delays, delays on intermediary devices and the time required for the web server to process a request. In the modern Internet the most delays are in the global network. Content delivery networks (CDN) reduce the delays by using points of presence (PoP) distributed around the world. If a website located in the US uses a CDN, then a user from Europe can fetch the web site data from the CDN’s PoP in Europe instead of accessing the US based origin server. However, software and hardware used in CDN may also introduce additional latency.
Tail latency, aka high-percentile latency, is tricky: while 99% and more clients’ requests are serviced quickly, very rare client requests experience delays much larger than several standard deviations. The latency is hard to catch using usual monitoring tools. In this article we’ll explore how to reveal a few reasons for huge tail latency in Nginx HTTP requests processing using perf and BPF. We’ll be analyzing a powerful CDN edge server operating in one of the world’s largest IXPs and we’ll find out that even lightweight tasks (e.g. a monitoring system) may dramatically impact the tail latency.
This article is the result of collaboration between Tempesta Technologies and G-Core Labs.
Reproducing the problem
We used a small Golang program (hereafter cdn-perf), which just calls curl several times per second for relatively long periods of time (like 30-120 minutes). curl can report various statistics about network delays, like TCP connection time (time_connect), TLS handshake time (time_appconnect), time to first byte (TTFB, time_starttransfer) and many others, less relevant for our investigation.
cdn-perf has shown delays more than 1 second for TCP handshake, TLS handshake and for the delay between finishing TLS handshake and receiving the first byte of an HTTP response. Sometimes the delays reached several seconds.
A quick analysis of the report of wireshark running on the machine with cdn-perf has shown the largest delays up to 12.6ms for TCP ACK RTT (tcp.analysis.ack_rtt), so the problem turned out to be not in the network, but with the CDN node. wireshark also has shown that TCP starts with the receive window about 20-40KB, which reaches 40-60KB by the end of the handshake, so up to 16KB TLS records can be transmitted in one round trip and we don’t have extra delays to start to decrypt TLS records. Since cdn-perf has shown about x100 larger delays, we weren’t interested in further investigations on the network layer.
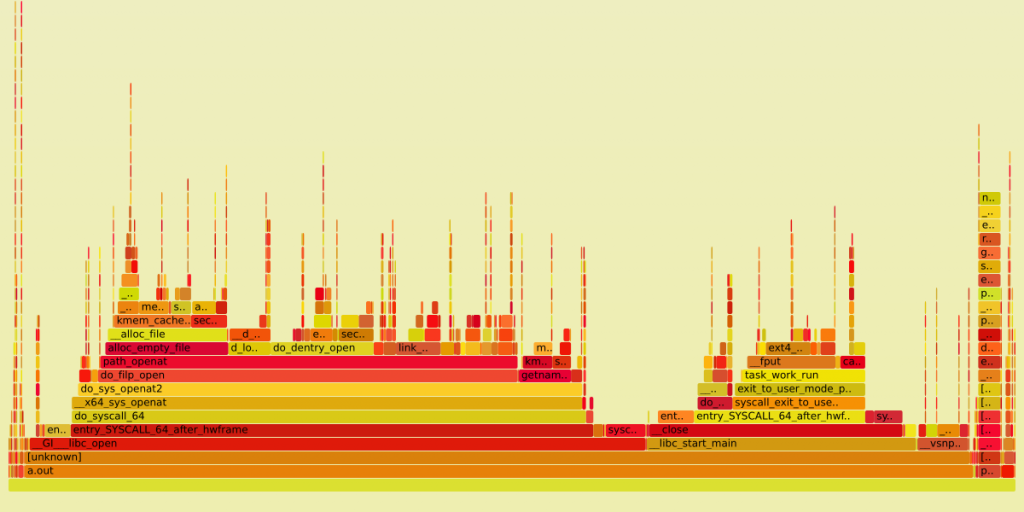
We also collected a flame graph for the CDN node under investigation. Yet since tail latency is a very rare event, flame graphs aren’t so useful for the problem analysis since they show the average statistics. However, the flame graph can be useful to reveal the most interesting call stacks for tracing.
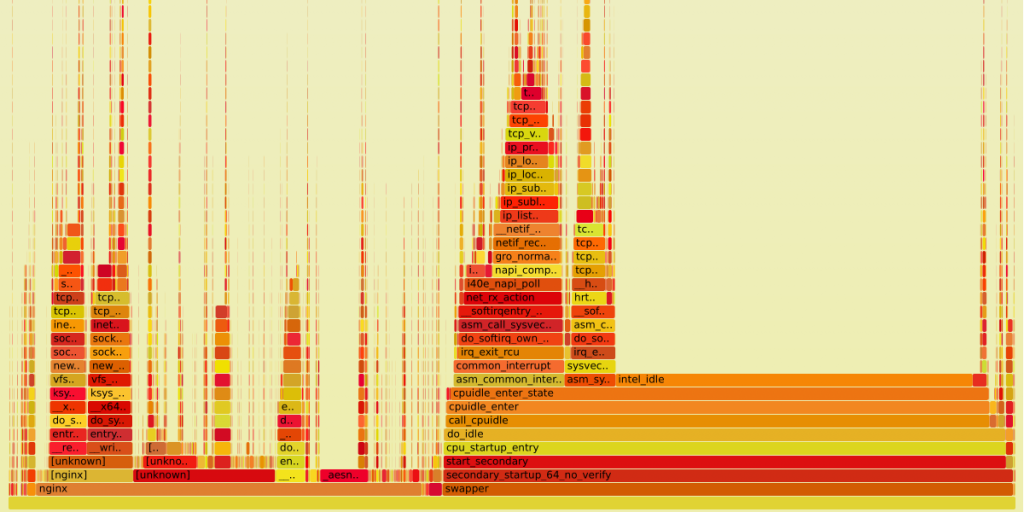
The graph above has 4 wide flames (from the left to the right):
- reading data from the Nginх socket using filesystem API (the flame has
skb_copy_datagram_iter()at the top – this is copying of data from the kernel to the user space) - writing data to the Nginx socket (
tcp_sendmsg()is on the top) - reading data by the NIC (
tcp_v4_rcv()is on the top) and reading the data byt the TCP/IP stack - TCP pacing (delayed TCP data transmission)
We started our analysis from tracing these functions. Let’s have a look at what we’ve found.
Nginx logs reopening
Tracing of the net_rx_action()’s run time and the time between receiving an icmp ping and sending a response didn’t show any significant delays, i.e. the problem is on the layers above, in the TCP/IP stack. To trace the TCP/IP stack we used the following bpftrace script to build a histogram for the delay between a socket buffer (sk_buff in the Linux kernel, one or more TCP segments) reception in tcp_v4_rcv() (we used this function because it has a sk_buff in the arguments) and copying the data to the user space:
#!/usr/bin/env bpftrace

#include <linux/ip.h>
#include <net/tcp.h>

k:tcp_v4_rcv
{
    $skb = (struct sk_buff *)arg0;
    /* see ip_hdr() and skb_network_header(). */
    $ih = (struct iphdr *)($skb->head + $skb->network_header);

    /* pton(83.229.25.107) = 0x6b19e553 */
    if ($ih->saddr == 0x6b19e553) {
        /* Use total length as a tag to avoid skb reusage. */
        @skbs[arg0] = (nsecs, $ih->tot_len);
    }
}

k:skb_copy_datagram_iter
/@skbs[arg0].0 != 0/
{
    $skb = (struct sk_buff *)arg0;
    $ih = (struct iphdr *)($skb->head + $skb->network_header);
    if (@skbs[arg0].1 != $ih->tot_len) {
        delete(@skbs[arg0]);
        return;
    }

    /* see TCP_SKB_CB(). */
    $tcb = (struct tcp_skb_cb *)$skb->cb;
    $th = (struct tcphdr *)($skb->head + $skb->transport_header);

    /* Non zero-size copies only. */
    if (arg3) {
        $dt = nsecs - @skbs[arg0].0;
        @ns = hist($dt);
        if ($dt > (uint64)1024 * 1024 * 1024) {
            printf("%s: %lums delay: len=%u/%ld syn=%u fin=%u seq=%u\n",
                   strftime("%H:%M:%S", nsecs), $dt/1000000, arg3,
                   $tcb->end_seq - $tcb->seq - $th->seq - $th->fin,
                   $th->syn, $th->fin, $th->seq);
        }
    }
    delete(@skbs[arg0]);
}

END {
    clear(@skbs);
}
Normally the delay between the calls is below 32ms (the histogram is in milliseconds):
@ns:
[2K, 4K)               4 |                                                    |
[4K, 8K)            1560 |@@@@@                                               |
[8K, 16K)          14683 |@@@@@@@@@@@@@@@@@@@@@@@@@@@@@@@@@@@@@@@@@@@@@@@@@@@@|
[16K, 32K)          3696 |@@@@@@@@@@@@@                                       |
[32K, 64K)           955 |@@@                                                 |
[64K, 128K)          668 |@@                                                  |
[128K, 256K)         526 |@                                                   |
[256K, 512K)         294 |@                                                   |
[512K, 1M)           116 |                                                    |
[1M, 2M)              52 |                                                    |
[2M, 4M)              24 |                                                    |
[4M, 8M)              33 |                                                    |
[8M, 16M)              1 |                                                    |
[16M, 32M)             3 |                                                    |
If cdn-perf shows high delays, like
2021/08/13 11:02:07 Start transfer > 1s (1.075s), please check server if it was ok, X-ID header: m9-up-gc91
2021/08/13 11:02:07 TLS handshake > 1s (1.07s)
2021/08/13 11:02:28 Start transfer > 1s (1.015s), please check server if it was ok, X-ID header: m9-up-gc95
2021/08/13 11:02:29 Start transfer > 1s (1.011s), please check server if it was ok, X-ID header: m9-up-gc95
2021/08/13 11:02:31 Start transfer > 1s (1.015s), please check server if it was ok, X-ID header: m9-up-gc95
2021/08/13 11:10:55 Start transfer > 1s (1.016s), please check server if it was ok, X-ID header: m9-up-gc95
, the we had up to 1 second spikes in the histogram:
@ns:
[2K, 4K)              14 |                                                    |
[4K, 8K)             912 |@@                                                  |
[8K, 16K)          21541 |@@@@@@@@@@@@@@@@@@@@@@@@@@@@@@@@@@@@@@@@@@@@@@@@@@@@|
[16K, 32K)         17850 |@@@@@@@@@@@@@@@@@@@@@@@@@@@@@@@@@@@@@@@@@@@         |
[32K, 64K)          5890 |@@@@@@@@@@@@@@                                      |
[64K, 128K)         5805 |@@@@@@@@@@@@@@                                      |
[128K, 256K)        5540 |@@@@@@@@@@@@@                                       |
[256K, 512K)        2621 |@@@@@@                                              |
[512K, 1M)          1476 |@@@                                                 |
[1M, 2M)            1008 |@@                                                  |
[2M, 4M)             375 |                                                    |
[4M, 8M)             189 |                                                    |
[8M, 16M)             75 |                                                    |
[16M, 32M)            39 |                                                    |
[32M, 64M)            18 |                                                    |
[64M, 128M)            4 |                                                    |
[128M, 256M)           4 |                                                    |
[256M, 512M)           1 |                                                    |
[512M, 1G)             3 |                                                    |
With a few more tests we noticed that the tail latency problem usually happens when Nginx reopens the log files with nginx -s reopen. To verify the whether Nginx logs reopening causes the latencies we used following script, which accepts 2 PIDs of Nginx master processes (the node runs 2 Nginx instances for frontend and backend logic):
#!/usr/bin/env bpftrace

uprobe:/usr/sbin/nginx:ngx_reopen_files
{
    @reopen[pid] = nsecs;
}

uretprobe:/usr/sbin/nginx:ngx_reopen_files
/@reopen[pid]/
{
    $dt = nsecs - @reopen[pid];
    if ($dt > (uint64)500 * 1000 * 1000) {
        printf("%s: %s(pid=%d) reopen files took %lums\n", strftime("%H:%M:%S", nsecs),
               comm, pid, $dt/1000000);
    }
    @reopen[pid] = 0;
}

uprobe:/usr/sbin/nginx:ngx_process_events_and_timers
{
    if (@worker_delay[pid]) {
        $dt = nsecs - @worker_delay[pid];
        @ns[pid] = hist($dt);
        if ($dt > (uint64)500 * 1000 * 1000) {
            printf("%s: %s:pid=%d delay=%lums\n", strftime("%H:%M:%S", nsecs),
                   comm, pid, $dt/1000000);
        }
    }
    @worker_delay[pid] = nsecs;
}

END {
    clear(@sig);
    clear(@worker_delay);
}
This script measures the time between ngx_process_events_and_timer() calls and how long does ngx_reopen_files() take. The script prints messages if any of the measurements takes longer than 500ms.
We made Nginx reload the log files with
$ sudo nginx -c /etc/nginx/nginx.conf -s reopen
$ sleep 60
$ sudo nginx -c /etc/nginx-cache/nginx.conf -s reopen
And observed following results:
- The time between
ngx_process_events_and_timer()calls is almost the same as the time spent inngx_reopen_files():
22:15:10: nginx(pid=57826) reopen files took 539ms
22:15:10: nginx:pid=57826 delay=547ms
....
22:15:10: nginx(pid=38083) reopen files took 1173ms
22:15:10: nginx:pid=38083 delay=1179ms
- The more Nginx workers reopen the logs, the bigger load is caused on the filesystem and slower the next reopens become. The worker, which starts to reopen the logs last, works with the overloaded filesystem and spends twice as much time for the operation.
- While some reopenings take more than 1s,
cdn-perfnot always reports huge delays. The server has 80 CPUs and correspondingly 80 Nginx worker processes for the Nginx frontend which experienced the huge delays.cdn-perfmakes several probes per second, but it’s still possible to not to probe the workers affected by the filesystem performance degradation.
The system call open(2) is a known performance killer, but we ran a little investigation of what happens in the syscall, which makes it so slow. To catch the clue we added a simple profiling for on-CPU and off-CPU call stacks:
profile:hz:100
/comm == "nginx"/
{
    if (@reopen[pid]) {
        @reopen_stacks[kstack()] = count();
    }
    else if (pid != $1 && pid != $2) {
        @nio_stacks[kstack()] = count();
    }
}
The profiling showed that the most frequent stack during the log files reopening is a filesystem mutex acquiring for writing:
@reopen_stacks[
    osq_lock+118
    rwsem_down_write_slowpath+1046
    down_write+65
    path_openat+680
    do_filp_open+145
    do_sys_openat2+540
    do_sys_open+70
    __x64_sys_open+33
    do_syscall_64+56
    entry_SYSCALL_64_after_hwframe+68
]: 141
Nginx reopens the log files in the main worker loop ngx_worker_process_cycle(): no events can be processed while it’s reopening the log files – Nginx can not read data from the sockets, can not accept a new connection. This explains the delay between entering the TCP/IP stack in tcp_v4_rcv() and reading the data in the user space.
We wrote a small C program opening many files in one directory concurrently in 100 processes (that was exactly the case for our Nginx setup – log files for thousands of clients, serviced by the CDN node, were stored in a single directory). The program also tests a more optimal approach – placing the files in different directories. (The cases are #ifdef’ed.)
#include <fcntl.h>
#include <stdio.h>
#include <stdlib.h>
#include <sys/stat.h>
#include <sys/types.h>
#include <sys/wait.h>
#include <unistd.h>

static const size_t THREADS = 100;
static const size_t FILES = 20000;

int
main(int argc, char *argv[])
{
    char fpath[100];
    int parent, status, fd, t, f;

    for (t = 0; t < THREADS; ++t)
        if (!(parent = fork()))
            break;

    if (parent) {
        for (t = 0; t < THREADS; ++t)
            wait(&status);
        return 0;
    }

#if 1
    for (f = 0; f < FILES; ++f) {
        snprintf(fpath, 100, "./g-test/%d", f);
        fd = open(fpath, O_WRONLY|O_CREAT|O_APPEND, 0644);
        if (fd < 0)
            abort();
        close(fd);
    }
#else
    for (t = 0; t < THREADS; ++t) {
        for (f = 0; f < FILES / THREADS; ++f) {
            snprintf(fpath, 100, "./g-test2/%d/%d", t, f);
            fd = open(fpath, O_WRONLY|O_CREAT|O_APPEND, 0644);
            if (fd < 0)
                abort();
            close(fd);
        }
    }
#endif

    return 0;
}
We ran the test on a workstation with EXT4 SATA Samsung EVO 960 (though we have much faster NVMe SSD drives on the server hardware, the cheap workstation hardware is still enough to reproduce the virtual filesystem bottleneck).
We made 3 runs for each version of the test and picked the best results. The best time for 100 directories:
$ rm ./g-test2/*/*; for i in `seq 0 100`; do mkdir -p ./g-test2/$i; done; time ./a.out

real    0m1.084s
user    0m0.768s
sys     0m3.327s
And for single shared directory:
$ rm ./g-test/*; time ./a.out

real    0m1.282s
user    0m0.711s
sys     0m4.137s
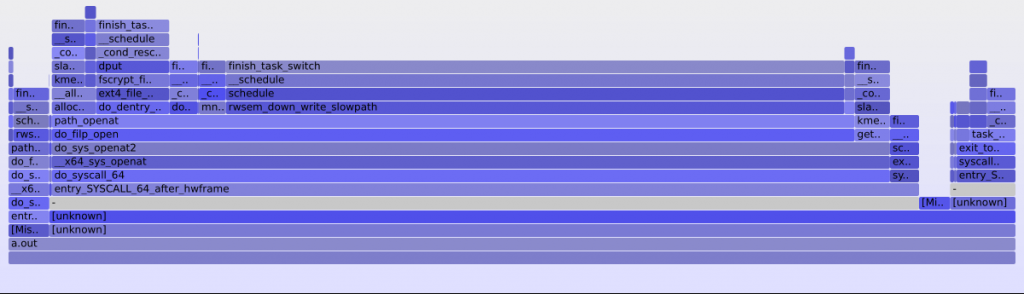
Note that even though in the test all 100 processes worked with the subdirectories in the same sequence, meaning we still have contention on the directory mutex, while to make files opening faster we should have opened each file in a random subdirectory, we still had a 20% performance improvement. This is a mutex contention, so it would have been better to compare off-CPU flame graphs, but for the tests we only had on-CPU flame graphs so we compared them and we still could see the difference between the tests. The flame graph for single directory is:
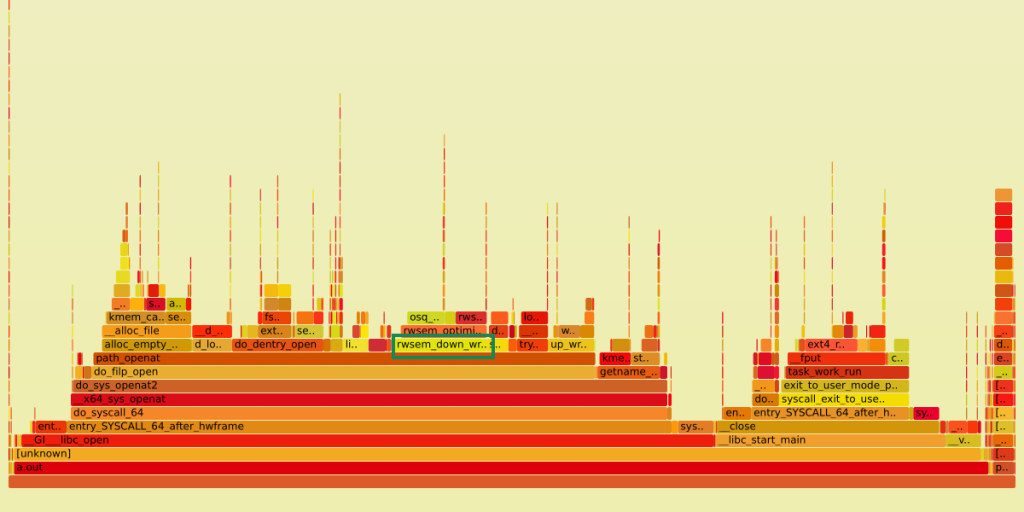
And for 100 directories:
We see that rwsem_down_write_slowpath() (selected with green on the first graph) has almost disappeared from path_openat() time (since these are on-CPU graphs, this means that the mutex is acquired more rarely, but we still spend much time under it).
This Nginx logs reopening problem can be solved in any of the ways:
- The most trivial way is just to configure Nginx to store log files for each vhost in a separate directory.
- Plus to the previous point, since all the workers are reopening logs in the same sequence, it still makes sense to patch Nginx to reopen logs in separate directories in a random sequence.
- Move the logs reopening out of the main worker loop and/or reopen logs asynchronously in a separate thread. This approach, as the previous two, still deals with files and just moves the problem from the worker threads instead of solving it.
- Patch Nginx to use rsyslogd (this is what we’ve chosen). The paper Building a 100K log/sec logging infrastructure by David Langcompares
rsyslogd,sysklogdandsyslog-ng. Though the paper is 10 years old, it demonstrates thatrsyslogdcan handle several hundred thousands log records per second.
We also considered writing all vhost records into the same log file. This approach makes the log file reopen faster. But all the Nginx workers contend on the file write mutex. Also the SSD drives, used in the servers, provide better performance on a deeper write queue, which is hard to get on sequential writes to a single file.
The Linux scheduler
The Nginx logs reopening introduced significant delays in HTTP requests processing, but that’s not the end of the story. There were also TTFB spikes for 200-600ms in average and up to 1s between the logs reopening.
Besides the cdn-perf reports we could observe the delays in TCP handshakes with tcpconnlat tool, which is a part of the BPF Compiler Collection (BCC). The tool works on the client side and we used curl for probes:
$ /usr/share/bcc/tools/tcpconnlat -t 10
  TIME(s)  PID    COMM         IP SADDR            DADDR            DPORT LAT(ms)
  0.000    475659 curl         4  83.229.25.107    92.223.123.22    443   51.24
  353.905  478247 curl         4  83.229.25.107    92.223.123.22    443   1052.05

                                                                          ^^^^^^^
ping also showed relatively large delays:
ping -c 600 -i 0.1 -q 92.223.123.22
...
rtt min/avg/max/mdev = 0.533/0.762/23.041/1.278 ms

                                   ^^^^^^
Neither ping time nor TCP handshake latency depend on the Nginx performance. The TCP handshake time in this case is measured on the client side, when it receives SYN-ACK, i.e. listen backlog overflow, probably caused by the Nginx logs reopening, could not affect the measurement.
The next script performs 2 measurements:
- the time between a network packet capturing in
net_rx_action()and entering into the TCP code intcp_v4_rcv(). This time was not more than 32ms in our measurements. - the time, which
tcp_v4_rcv()spends. Our measurements showed not more than 16ms. This script can not be run for a long time (10 minutes in our case)! Longer running time may lead to significant performance degradation of the system.
#!/usr/bin/env bpftrace

k:net_rx_action
{
    @rx[cpu] = nsecs;
}

// Measure the delay only before the first TCP call in the batch.
k:tcp_v4_rcv
/@rx[cpu]/
{
    @ns_net_rx_tcp = hist(nsecs - @rx[cpu]);
    @tcp_rcv[cpu] = nsecs;
}

kr:tcp_v4_rcv
/@tcp_rcv[cpu]/
{
    @ns_tcp_rcv = hist(nsecs - @tcp_rcv[cpu]);

    delete(@tcp_rcv[cpu]);
}

kr:net_rx_action
/@rx[cpu]/
{
    @ns_rx = hist(nsecs - @rx[cpu]);

    delete(@rx[cpu]);
}

END {
    clear(@rx);
    clear(@tcp_rcv);
}
The delay times are very small, so our problem is somewhere else. The next script checks for the known problem of TCP socket lookups in the hash table on multi-core systems:
#!/usr/bin/env bpftrace

k:__inet_lookup_listener
{
    @lh[cpu] = nsecs;
}

kr:__inet_lookup_listener
/@lh[cpu]/
{
    @ns_lh = hist(nsecs - @lh[cpu]);
}

k:__inet_lookup_established
{
    @eh[cpu] = nsecs;
}

kr:__inet_lookup_established
/@eh[cpu]/
{
    @ns_eh = hist(nsecs - @eh[cpu]);
}

END {
    clear(@lh);
    clear(@eh);
}
The maximum delays caught by the script are below 4ms for established socket lookup and below 0.128ms for listening sockets. Again, the delays are magnitudes smaller than the 200-600ms, which we were looking for.
The next try is to measure the time between finishing a TCP handshake and accept()’ing the connection by Nginx.
#!/usr/bin/env bpftrace
// Profile and measure Nginx any time except files reopen to catch small delays.

#include <net/tcp.h>

uretprobe:/usr/sbin/nginx:ngx_reopen_files
{
    @reopen[pid] = nsecs;
}

k:tcp_set_state
/arg1 == 1/ // TCP_ESTABLISHED
{
    $sk = (struct sock *)arg0;
    $daddr = $sk->__sk_common.skc_daddr;
    $dport = $sk->__sk_common.skc_dport;
    $lport = $sk->__sk_common.skc_num;

    if ($lport == 443) {
        @accept[$daddr, $dport] = nsecs;
    }
}

// Accepting TCP sockets: __sys_accept4_file() -> inet_accept() -> inet_csk_accept().
// For tracing we need already accepted new socket, so hook security_sock_graft()
// called from inet_accept() -> sock_graft().
k:security_sock_graft
{
    $sk = (struct sock *)arg0;
    $daddr = $sk->__sk_common.skc_daddr;
    $dport = $sk->__sk_common.skc_dport;
    $lport = $sk->__sk_common.skc_num;

    if (!@accept[$daddr, $dport]) {
        return;
    }

    if (comm == "nginx" && $lport == 443
        && (!@reopen[pid] || @reopen[pid] < @accept[$daddr, $dport]))
    {
        $delta = nsecs - @accept[$daddr, $dport];
        @accept_ns = hist($delta);
        if ($delta > (uint64)100 * 1000 * 1000) {
            printf("%s: PID %u accepts connection for %ums from %14s:%-6d\n",
                strftime("%H:%M:%S", nsecs), pid, $delta / 1000 /1000,
                ntop($daddr),
                ($dport >> 8) | (($dport << 8) & 0x00FF00));
        }

        @ttfb[$daddr, $dport] = nsecs;
    }

    delete(@accept[$daddr, $dport]);
}

k:tcp_sendmsg
/comm == "nginx"/
{
    $sk = (struct sock *)arg0;
    $tp = (struct tcp_sock *)$sk;
    $data_len = arg2;
    $daddr = $sk->__sk_common.skc_daddr;
    $dport = $sk->__sk_common.skc_dport;
    $lport = $sk->__sk_common.skc_num;

    if (!@ttfb[$daddr, $dport]) {
        return;
    }

    if ($lport == 443
        && (!@reopen[pid] || @reopen[pid] < @ttfb[$daddr, $dport]))
    {
        $delta = nsecs - @ttfb[$daddr, $dport];
        @ttfb_ns = hist($delta);
        if ($delta > (uint64)100 * 1000 * 1000) {
            printf("%s: PID %u TTFB = %ums for %14s:%-6d\n",
                strftime("%H:%M:%S", nsecs), pid, $delta / 1000 /1000,
                ntop($daddr),
                ($dport >> 8) | (($dport << 8) & 0x00FF00));
        }
    }
    delete(@ttfb[$daddr, $dport]);
}

END {
    clear(@accept);
    clear(@ttfb);
    clear(@reopen);
}
This script reported delays up to 64ms. The delay doesn’t look so innocent. TCP handshake is performed by the Linux softirqs (interrupt bottom halves), i.e. the operating system kernel. Meantime accept() is done in the Nginx process context. Thus, we have something going on between the kernel and user space contexts.
The server load average was quite reasonable, about 40-50 for the 80 CPU server. However, BPF was constantly reporting delays up to 127ms:
$ sudo /usr/share/bcc/tools/runqlat -mT 60
Tracing run queue latency... Hit Ctrl-C to end.
^C
17:04:10
     msecs               : count     distribution
         0 -> 1          : 1780549  |****************************************|
         2 -> 3          : 8448     |                                        |
         4 -> 7          : 6834     |                                        |
         8 -> 15         : 2901     |                                        |
        16 -> 31         : 138      |                                        |
        32 -> 63         : 13       |                                        |
        64 -> 127        : 153      |                                        |
We started to investigate the operating system scheduler.
$ sudo /usr/share/bcc/tools/runqslower 50000
This BCC tool catches run queue delays larger than 50ms. We ran htop and cdn-perf concurrently with the script and observed following correlation:
$ cdn-perf
2021/09/01 17:23:18 Start transfer > 1s (1.45s), please check server if it was ok, X-ID header: m9-up-gc91
2021/09/01 17:23:18 TLS handshake > 1s (1.308s)
2021/09/01 17:23:22 Start transfer > 1s (1.102s), please check server if it was ok, X-ID header: m9-up-gc91
2021/09/01 17:23:22 TLS handshake > 1s (1.064s)
2021/09/01 17:25:56 Start transfer > 1s (1.631s), please check server if it was ok, X-ID header: m9-up-gc91
2021/09/01 17:25:56 TLS handshake > 1s (1.587s)
runqslower reported delays up to 100ms for the same time frame:
TIME     COMM             TID           LAT(us)
17:22:01 ksoftirqd/36     195             88372
17:22:01 nginx            6402            96403
17:22:01 nginx            34628           97208
17:23:01 migration/78     404             68459
17:23:01 ksoftirqd/78     405             76403
17:24:01 kworker/79:2     43227           57803
17:25:01 nginx            7198            90517
17:25:01 ksoftirqd/70     365             81861
17:25:01 nginx            43539           95270
17:25:01 nginx            7145            89796
17:25:01 ksoftirqd/37     200             84036
17:25:01 nginx            6442            96320
17:25:01 nginx            34856          100470
17:25:01 migration/33     179             84159
17:25:01 nginx            5249            85923
17:25:01 ksoftirqd/33     180             84194
17:25:01 nginx            7140            83195
17:25:01 nginx            33641           93514
17:25:01 nginx            7132            94883
17:25:01 nginx            32253          106199
17:25:01 nginx            36418           52045
17:25:02 nginx            31809           53441
17:25:02 nginx            40272           56187
17:26:01 migration/39     209             76745
17:26:01 nginx            7148            80696
17:26:01 ksoftirqd/39     210             76700
17:26:01 nginx            7134            88789
17:26:01 nginx            35024           86213
17:26:01 kworker/30:1     2081            95017
17:26:01 ksoftirqd/30     165             95041
htop showed several CPU spikes up to 100% for this time frame. We have the clue.
With the next step we collected statistics from the scheduler
$ sudo perf sched record -- sleep 60
Next, we process the history, reported by
$ perf sched timehist -MVw
In particular, we selected the maximum sched delay among all the Nginx workers:
$ grep '54690\|55112\|55435\|55461\|55474\|55750\|56146\|56520\|56553\|56577\|56795\
        |57242\|57635\|57661\|57686\|57927\|58345\|58748\|58762\|58786\|59054\|59462\
        |59818\|59830\|59853\|60122\|60510\|60880\|60903\|60912\|61211\|61631\|61947\
        |61955\|61976\|62310\|62719\|63072\|63084\|63117\|63421\|63823\|64160\|64173\
        |64215\|64497\|64955\|65325\|65469\|65498\|65752\|66194\|66552\|66587\|66659\
        |67035\|67462\|67728\|67748\|67757\|67938\|68345\|68701\|68867\|68931\|68943\
        |69304\|69563\|69657\|69703\|70015\|70081\|70102\|70293\|70730\|71112\|71178\
        |71198\|71283\|71636\|72054' \
  sched-timehist.perf |awk '{print $5}'|sort -nu | tail
82.062
83.449
83.479
83.531
84.350
84.917
85.519
86.442
88.586
91.392
There was a process, which was waiting in the run queue for 91ms! Let’s have a look at the several events on the CPU core, where the process was waiting for so long, before the long waiting happened (this is extended output with the CPU map and the scheduler events):
$ perf sched timehist -MVw
           time    cpu  0...f  task name             wait time  sch delay   run time
                               [tid/pid]                (msec)     (msec)     (msec)
--------------- ------  -...-  --------------------  ---------  ---------  ---------

. . .
  502266.664504 [0039]    s    nginx[63117]           1.113         0.029      0.035
  502266.669718 [0039]         telegraf[7038/6944]                                   awakened: nginx[63117]
  502266.761970 [0039]         nginx[63117]                                          awakened: nginx[31154]
  502266.762767 [0039]         nginx[63117]                                          awakened: nginx[63072]
  502266.764538 [0039]    s    nginx[63117]           96.606        91.392      3.426
I.e. telegraf (pid 6944, a monitoring process) at 502266.669718 woke up nginx on CPU 39, but the scheduler switched to the nginx process only at 502266.764538, almost 100ms later. perf sched script for this time interval shows that all the 100ms the CPU was running the telegraf process. /proc/6944/sched showed
nr_voluntary_switches                        :                  985
nr_involuntary_switches                      :                    1
i.e. the process was never preempted by the scheduler (well, it has been preempted only once). Meantime, /proc//sched for any Nginx process shows much large number of involuntary switches:
nr_voluntary_switches                        :              1857149
nr_involuntary_switches                      :               113766
, i.e. Nginx processes were frequently preempted.
The Linux Completely Fair Scheduler (CFS) targets to achieve a proportional amount of compute time to each task. CFS arranges scheduling entities (tasks) according to when their next timeslices would start execution (vruntime). Once a task (Nginx in our case) fully utilizes all of the timeslices, provided to it by the scheduler, the task is considered to get the next timeslice late (bigger vruntime). From the other side, if a task (the monitoring process in our case) frequently yields the CPU time, i.e. it was executed least so far and has the smallest vruntime, then it gets the next timeslice earlier. See also the comment from linux/kernel/sched/fair.c for the exact formulas.
Since the monitoring process frequently yields the CPU, while Nginx actively consumes the CPU time, there is a compute time disproportion between the processes and CFQ does it’s best to fix the disproportion. This way the telegraf process gets a long time slice, while Nginx starves the CPU time and we observe the huge delays. Usually there is not much business for the monitoring process, but this time was different – the process has a lot to do and the scheduler granted enough time to the process.
Besides the Nginx processes, the same delays happen for ksoftirqd (the kernel thread, which executes the TCP/IP stack code) – up to 2.4ms.
It’s worth mentioning that the perf sched statistics were collected for 60 seconds only, while we needed several minutes to observe the 1s tail latencies in TTFB. I.e. the scheduler latencies apparently reach even higher values.
We’ll address the way to fix the CPU scheduling problem in a next blog post, but now let’s have a look at how to reveal one more performance issue with Nginx.
A few words about CPU locality
We ran one more BCC tool to trace the Nginx event loop:
$ sudo /usr/share/bcc/tools/funclatency -d 1800 -m nginx:ngx_process_events_and_timers \
  > ngx_event_delay3.log
During these 30 minutes there were no reports for the event loop delays larger than 16ms. We were confused observing traces of less than a half of the Nginx worker processes, so we used the old and good gdb to check the results:
$ for p in `pidof nginx`; do sudo gdb --batch -ex "thread apply all bt" -p $p > $p; done
OK, the rest of the processes are sitting in epoll(). By the way,
$ top -b -n 1|grep nginx
also shows many Nginx workers with zero CPU usage. One more evidence of the problem can be illustrated by wait time in perf sched timehist:
$ grep '54690\|55112\|55435\|55461\|55474\|55750\|56146\|56520\|56553\|56577\
        |56795\|57242\|57635\|57661\|57686\|57927\|58345\|58748\|58762\|58786\
        |59054\|59462\|59818\|59830\|59853\|60122\|60510\|60880\|60903\|60912\
        |61211\|61631\|61947\|61955\|61976\|62310\|62719\|63072\|63084\|63117\
        |63421\|63823\|64160\|64173\|64215\|64497\|64955\|65325\|65469\|65498\
        |65752\|66194\|66552\|66587\|66659\|67035\|67462\|67728\|67748\|67757\
        |67938\|68345\|68701\|68867\|68931\|68943\|69304\|69563\|69657\|69703\
        |70015\|70081\|70102\|70293\|70730\|71112\|71178\|71198\|71283\|71636\
        |72054' sched-timehist.perf |awk '{print $4}'|sort -nu | tail
2570.531
2584.483
2584.700
3635.875
3807.873
4999.566
4999.568
5000.108
6137.164
12166.969
I.e. several Nginx workers were doing nothing for 2-12 seconds in the 60 second measurement (this is up to 20% of time!). Also the workers have very different runtime:
$ grep '54690\|55112\|55435\|55461\|55474\|55750\|56146\|56520\|56553\|56577\|56795\
        |57242\|57635\|57661\|57686\|57927\|58345\|58748\|58762\|58786\|59054\|59462\
        |59818\|59830\|59853\|60122\|60510\|60880\|60903\|60912\|61211\|61631\|61947\
        |61955\|61976\|62310\|62719\|63072\|63084\|63117\|63421\|63823\|64160\|64173\
        |64215\|64497\|64955\|65325\|65469\|65498\|65752\|66194\|66552\|66587\|66659\
        |67035\|67462\|67728\|67748\|67757\|67938\|68345\|68701\|68867\|68931\|68943\
        |69304\|69563\|69657\|69703\|70015\|70081\|70102\|70293\|70730\|71112\|71178\
        |71198\|71283\|71636\|72054' sched-timehist.perf |awk '{print $6}'|sort -nu \
        | head -5
0.000
0.001
0.002
0.003
0.004

$ grep '54690\|55112\|55435\|55461\|55474\|55750\|56146\|56520\|56553\|56577\|56795\
        |57242\|57635\|57661\|57686\|57927\|58345\|58748\|58762\|58786\|59054\|59462\
        |59818\|59830\|59853\|60122\|60510\|60880\|60903\|60912\|61211\|61631\|61947\
        |61955\|61976\|62310\|62719\|63072\|63084\|63117\|63421\|63823\|64160\|64173\
        |64215\|64497\|64955\|65325\|65469\|65498\|65752\|66194\|66552\|66587\|66659\
        |67035\|67462\|67728\|67748\|67757\|67938\|68345\|68701\|68867\|68931\|68943\
        |69304\|69563\|69657\|69703\|70015\|70081\|70102\|70293\|70730\|71112\|71178\
        |71198\|71283\|71636\|72054' sched-timehist.perf |awk '{print $6}'|sort -nu \
        | tail -5
9.959
9.963
9.980
13.988
40.385
This is a known problem, which can be solved with socket options. SO_REUSEPORT allows many Nginx workers to accept connections concurrently on the same port using different, per-process, sockets. Typically, Nginx workers are pinned to CPUs. On the other hand, TCP segments for the same connection are processed on the same RX queue pinned to a CPU. The problem is that the CPU of the RX queue may differ from the CPU of Nginx worker, processing the socket for a TCP connection. Receive Flow Steering (RFS) may schedule a process working with a TCP socket to the CPU, which processes the RX queue for the socket. However, having that a single Nginx process handles thousands of sockets, the rescheduling doesn’t make sense. So SO_INCOMING_CPU and SO_ATTACH_REUSEPORT_EBPF socket options define how TCP segments are distributed among sockets, so each segment is processed on the same CPU from the kernel RX queue and to the Nginx process. We recommend watching the recent talk from the Linux Plumbers conference about SO_REUSEPORT, it’s issues and workarounds.
We are hiring! Take a look at our opportunities
Need faster, scalable software?